12. Tutorial: Fractals
In mathematics, a fractal is a subset of Euclidean space with a fractal dimension that strictly exceeds its topological dimension.
—Wikipedia
A fractal is a never-ending pattern. Fractals are infinitely complex patterns that are self-similar across different scales. They are created by repeating a simple process over and over in an ongoing feedback loop. Fractal patterns are extremely familiar, since nature is full of fractals. For instance: trees, rivers, coastlines, mountains, clouds, seashells, hurricanes, etc.
—Fractal Foundation
Fractals are very interesting things if you’re studying maths, but even if you are not, they are still just plain fun because:
They make pretty pictures when drawn on the screen.
They require very little code to draw.
You can zoom in forever and always find new details, yet you don’t have to write any extra code.
We are going to write a program to draw one fractal in particular, the Mandelbrot set.
12.1. Mandelbrot set
We are going to skip through the maths so we can get straight to coding, but if you would like to understand complex numbers, watch this video or ask your maths teacher.
Every complex number is either in the Mandelbrot set, or out of the Mandelbrot set. To decide which it is, we do an iteration:
If z gets bigger and bigger (tends towards infinity) then c is in the set. If it stays in the range of -2 to 2, then c is not in the set. However, we don’t want to perform the iteration infinity times, so we are going to limit it to 80 iterations of the loop. If it’s still in the range after that, we will return 80. If it goes outside the range, then we will return how many iterations it took.
(We could have simply returned True or False but we are going to use the number of iterations for something later.)
Here is our function. It takes a complex number c, and it returns the number of iterations
(which will be 80 if c is in the Mandelbrot set.)
MAX_ITER = 80

def mandelbrot(c):
    z = 0
    n = 0
    while abs(z) <= 2 and n < MAX_ITER:
        z = z * z + c
        n += 1
    return n
Now we just need a function to draw the points on the screen. We have two for loops, one inside the other,
which loop over every pixel on the screen. For each pixel, we convert the x and y coordinates into a complex
number. We then send that number to the mandlebrot() function, and depending on what it returns we plot either a black
pixel or a white pixel.
def draw2d():
    for x in range(0, WIDTH):
        for y in range(0, HEIGHT):
            c = complex((RE_START + (x / WIDTH) * RE_WIDTH),
                        (IM_START + (y / HEIGHT) * IM_HEIGHT))
            m = mandelbrot(c)
            color = BLACK if m == MAX_ITER else WHITE
            draw_pixel(x, y, color)
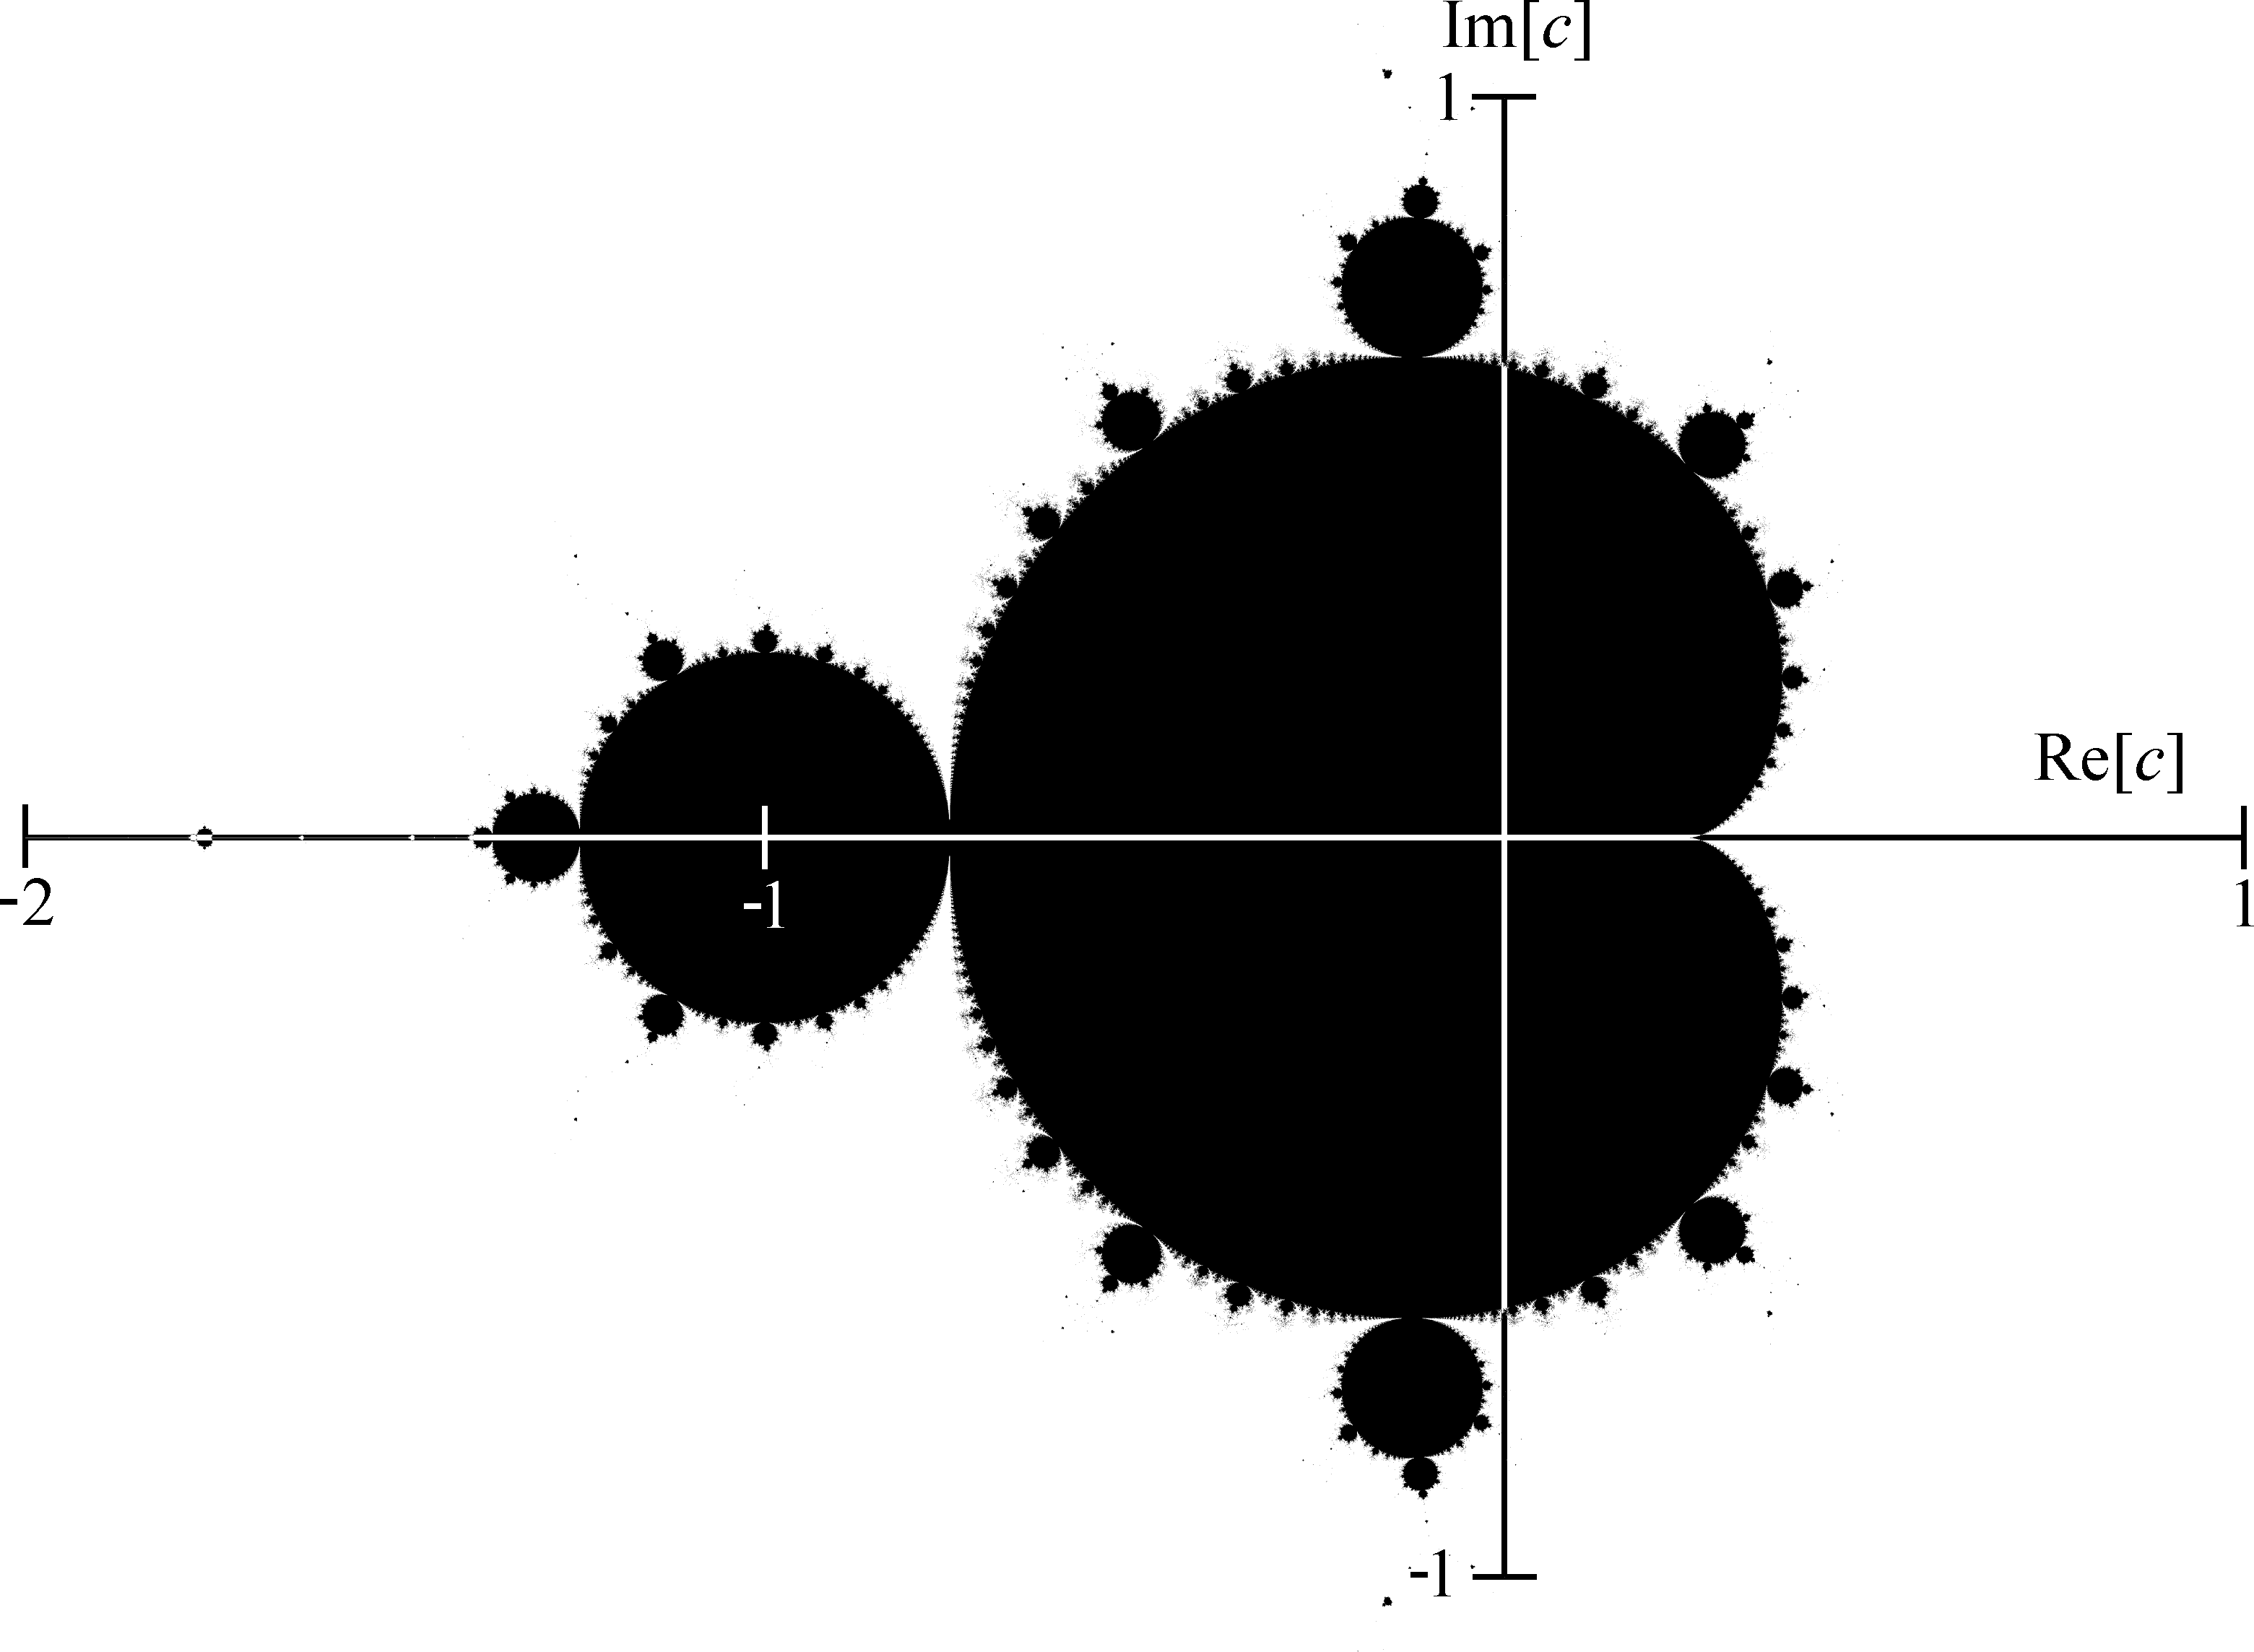
Fig. 12.1 Complex plain
A Mandlebrot is drawn in the complex plain. This means that the axes are not labelled x and y. Instead we call the horizontal axis RE (for ‘real’) and the vertical axis IM (for ‘imaginary’). These terms come from the maths of complex numbers. So we define some constants to specify the left, right, top and bottom limits of the graph:
RE_START = -2
RE_END = 1
IM_START = -1
IM_END = 1
RE_WIDTH = (RE_END - RE_START)
IM_HEIGHT = (IM_END - IM_START)
Here is the complete program to type in and run:
 1from rlzero import *
 2
 3WIDTH = 700
 4HEIGHT = 400
 5RE_START = -2
 6RE_END = 1
 7IM_START = -1
 8IM_END = 1
 9RE_WIDTH = (RE_END - RE_START)
10IM_HEIGHT = (IM_END - IM_START)
11MAX_ITER = 80
12
13
14def mandelbrot(c):
15    z = 0
16    n = 0
17    while abs(z) <= 2 and n < MAX_ITER:
18        z = z * z + c
19        n += 1
20    return n
21
22
23def draw2d():
24    for x in range(0, WIDTH):
25        for y in range(0, HEIGHT):
26            c = complex((RE_START + (x / WIDTH) * RE_WIDTH),
27                        (IM_START + (y / HEIGHT) * IM_HEIGHT))
28            m = mandelbrot(c)
29            color = BLACK if m == MAX_ITER else WHITE
30            screen.draw_pixel(x, y, color)
31
32
33run()
12.2. Shades of Grey
The reason we returned the number of iterations is that for a point outside of the Mandlebrot set, this number tells us how far outside it is. So instead of just plotting black and white for in or out we can plot shades of grey.
Here is the modified function that does this,
def draw2d():
    for x in range(0, WIDTH):
        for y in range(0, HEIGHT):
            c = complex((RE_START + (x / WIDTH) * RE_WIDTH),
                        (IM_START + (y / HEIGHT) * IM_HEIGHT))
            m = mandelbrot(c)
            i = 255 - int(255 * m / MAX_ITER)
            color = (i, i, i, 255)
            draw_pixel(x, y, color)
Modify your draw2d() function and run.
12.3. Colours
In the previous function we created an RGB color where the red, green and blue values were the all same, i.e. a shade of grey.
RGB is the most common colour space, but it is not only one. The HSV colour space is useful because one single value, the hue, can be changed to produce completely different colours.
def draw2d():
    for x in range(0, WIDTH):
        for y in range(0, HEIGHT):
            c = complex((RE_START + (x / WIDTH) * RE_WIDTH),
                        (IM_START + (y / HEIGHT) * IM_HEIGHT))
            m = mandelbrot(c)
            hue = int(255 * m / MAX_ITER)
            saturation = 255
            value = 255 if m < MAX_ITER else 0
            color = color_from_hsv(hue, saturation, value)
            draw_pixel(x, y, color)
Modify your draw2d() function and run.
12.4. Zooming in
Lets introduce a new variable, zoom. We will multiply our co-ordinates by this factor to enable zooming.
We will also add an update function. This is called automatically and will handle input. You can now
hold down the space and enter keys to zoom in and out, and hold the cursor keys to move around.
 1from rlzero import *
 2
 3WIDTH = 700
 4HEIGHT = 400
 5RE_START = -2
 6RE_END = 1
 7IM_START = -1
 8IM_END = 1
 9RE_WIDTH = (RE_END - RE_START)
10IM_HEIGHT = (IM_END - IM_START)
11MAX_ITER = 80
12
13zoom = 1.0
14
15
16def mandelbrot(c):
17    z = 0
18    n = 0
19    while abs(z) <= 2 and n < MAX_ITER:
20        z = z * z + c
21        n += 1
22    return n
23
24
25def draw2d():
26    for x in range(0, WIDTH):
27        for y in range(0, HEIGHT):
28            c = complex((RE_START + (x / WIDTH) * RE_WIDTH) * zoom,
29                        (IM_START + (y / HEIGHT) * IM_HEIGHT) * zoom)
30            m = mandelbrot(c)
31            hue = int(255 * m / MAX_ITER)
32            saturation = 255
33            value = 255 if m < MAX_ITER else 0
34            color = screen.color_from_hsv(hue, saturation, value)
35            screen.draw_pixel(x, y, color)
36
37
38def update():
39    global zoom, IM_START, RE_START
40    if keyboard.space:
41        zoom *= 1.2
42    elif keyboard.enter:
43        zoom *= 0.8
44    elif keyboard.up:
45        IM_START -= 0.2
46    elif keyboard.down:
47        IM_START += 0.2
48    elif keyboard.left:
49        RE_START -= 0.2
50    elif keyboard.right:
51        RE_START += 0.2
52
53
54run()
This is the complete program. Modify yours to match, or enter it again, and run it.
Note
Zooming will be slow and you may have to hold keys down for a long time before anything happens! We will try to improve this next.
12.5. Performance
The draw2d() function is called automatically, up to 60 times per second, and every time it is called we plot
a new fractal. This is very inefficient, because we are re-plotting the fractal even when it has not changed at all.
So, we will move the plotting code into a new function. Instead of plotting directly to the screen, we will create
an image object and plot to this.
def plot_image():
    for x in range(0, WIDTH):
        for y in range(0, HEIGHT):
            c = complex((RE_START + (x / WIDTH) * RE_WIDTH),
                        (IM_START + (y / HEIGHT) * IM_HEIGHT))
            m = mandelbrot(c)
            hue = int(255 * m / MAX_ITER)
            saturation = 255
            value = 255 if m < MAX_ITER else 0
            color = pyray.color_from_hsv(hue, saturation, value)
            image_draw_pixel(image, x, y, color)


image = gen_image_color(WIDTH, HEIGHT, GREEN)
plot_image()
We can’t draw the image directly to the screen; it must be converted into a texture first. Unfortunately we can’t create
a texture too early in the program, because it requires the GPU to have been initialized. Therefore we do this in a special init()
function which RLZero calls automatically after initialization.
def init():
    global texture
    texture = load_texture_from_image(image)
    set_texture_filter(texture, TEXTURE_FILTER_BILINEAR)
Now our draw2d() function only has to update the texture based on the latest image and draw it to the screen, which
is much faster than re-plotting the whole thing.
def draw2d():
    update_texture(texture, image.data)
    draw_texture_ex(texture, (0, 0), 0, 1, WHITE)
Finally, we must remember to re-plot the image if the user presses any keys:
def update():
    global zoom, IM_START, RE_START
    if keyboard.space:
        zoom = zoom * 1.2
        plot_image()
    elif keyboard.enter:
        zoom = zoom * 0.8
        plot_image()
    elif keyboard.up:
        IM_START -= 0.2
        plot_image()
    elif keyboard.down:
        IM_START += 0.2
        plot_image()
    elif keyboard.left:
        RE_START -= 0.2
        plot_image()
    elif keyboard.right:
        RE_START += 0.2
        plot_image()
Complete program:
 1from rlzero import *
 2
 3WIDTH = 700
 4HEIGHT = 400
 5RE_START = -2
 6RE_END = 1
 7IM_START = -1
 8IM_END = 1
 9RE_WIDTH = (RE_END - RE_START)
10IM_HEIGHT = (IM_END - IM_START)
11MAX_ITER = 80
12
13zoom = 1.0
14
15
16def mandelbrot(c):
17    z = 0
18    n = 0
19    while abs(z) <= 2 and n < MAX_ITER:
20        z = z * z + c
21        n += 1
22    return n
23
24
25def plot_image():
26    for x in range(0, WIDTH):
27        for y in range(0, HEIGHT):
28            c = complex((RE_START + (x / WIDTH) * RE_WIDTH) * zoom,
29                        (IM_START + (y / HEIGHT) * IM_HEIGHT) * zoom)
30            m = mandelbrot(c)
31            hue = int(255 * m / MAX_ITER)
32            saturation = 255
33            value = 255 if m < MAX_ITER else 0
34            color = screen.color_from_hsv(hue, saturation, value)
35            screen.image_draw_pixel(image, x, y, color)
36
37
38image = screen.gen_image_color(WIDTH, HEIGHT, GREEN)
39plot_image()
40
41
42def init():
43    global texture
44    texture = screen.load_texture_from_image(image)
45    screen.set_texture_filter(texture, screen.TEXTURE_FILTER_BILINEAR)
46
47
48def draw2d():
49    screen.update_texture(texture, image.data)
50    screen.draw_texture_ex(texture, (0, 0), 0, 1, WHITE)
51
52def update():
53    global zoom, IM_START, RE_START
54    if keyboard.space:
55        zoom *= 1.2
56        plot_image()
57    elif keyboard.enter:
58        zoom *= 0.8
59        plot_image()
60    elif keyboard.up:
61        IM_START -= 0.2
62        plot_image()
63    elif keyboard.down:
64        IM_START += 0.2
65        plot_image()
66    elif keyboard.left:
67        RE_START -= 0.2
68        plot_image()
69    elif keyboard.right:
70        RE_START += 0.2
71        plot_image()
72
73run()
12.6. Quality setting
It would be nice if we could make the window bigger so we can see the fractal more easily, but depending on the speed of your computer you may already find even the small window is very slow.
A simple way of speeding it up is to plot the image at a lower resolution and scale it up to full size when we draw the texture to the screen.
Change the resolution at the top of the program, and add a SCALE variable:
WIDTH = 1920
HEIGHT = 1080
SCALE = 4
Change the first part of the plot_image function to use the SCALE:
def plot_image():
    for x in range(0, WIDTH//SCALE):
        for y in range(0, HEIGHT//SCALE):
            c = complex((RE_START + (x / (WIDTH//SCALE)) * RE_WIDTH) * zoom,
                        (IM_START + (y / (HEIGHT//SCALE)) * IM_HEIGHT) * zoom)
Change the draw_2d() function to use the SCALE:
def draw2d():
    update_texture(texture, image.data)
    draw_texture_ex(texture, (0,0), 0, SCALE, WHITE)
Run the program and experiment with different SCALE values.
12.7. Further improvements
If you have ever used a fractal viewer program before, you will probably notice that it is faster than the simple one we have written. How could we make ours faster?
Divide the image up into parts and use multiple CPUs to plot the different parts of the image simultaneously.
Save images once they are plotted so they don’t need to be plotted again if the user returns to them.
When scrolling, don’t re-plot the whole image; just move the existing data and re-plot the now empty part.
When zooming in, first scale-up the existing image to generate a low quality zoomed image, then plot a higher quality one later.
Begin plotting with a low resolution image and then replace it with a higher resolution one later.